Imagine you run a bakery, and one day a customer reports getting sick after eating your pastries. Concerned, you conduct a thorough investigation to determine the root cause. However, as you took a deeper look into the process, you realized there are numerous gaps in your food safety procedures: perhaps some ingredients weren’t stored properly, or there were inconsistencies in temperature control during baking. You address these issues, thinking you’ve solved the problem. Yet, despite your efforts, customers continue to report similar illnesses. It dawns on you that while you’ve fixed potential issues that could lead to food safety problems, the true root cause remains elusive.
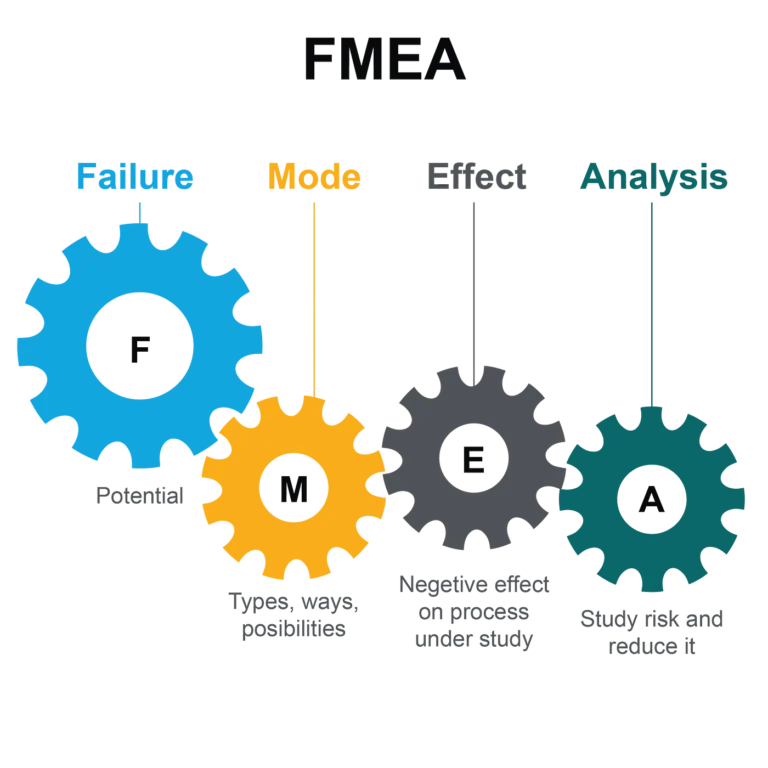
To ensure you’re chasing the right lead in root cause analysis for food safety or quality issues, employing tools like a fishbone diagram or a failure mode and effect analysis can be immensely helpful. In this episode of tools used in root cause analysis, we will look into using the Fishbone Diagram to address a food safety and quality issue. In another episode, we will deal with Failure Mode and Effect Analysis (FMEA).
A fishbone diagram, also known as an Ishikawa diagram, allows you to visually map out potential causes of a problem, categorizing them into different branches such as people, processes, materials, and environment. On the other hand, a Failure Mode and Effect Analysis (FMEA) helps you assess the potential failure modes of a process, product, or system, along with their potential effects.
The Fishbone Diagram
In root cause analysis (RCA), the fishbone diagram, or Ishikawa diagram, is a valuable brainstorming and analysis tool. It helps you visually organize potential causes of a problem into categories, facilitating a systematic exploration of all possible contributing factors.
How to use the Fishbone Diagram
There are three steps to follow when conducting a root cause analysis using the Fishbone Diagram. The first step is to define the problem, which is the fish’s head. The second step is to identify the main-cause category which could include people, materials, methods, machines, measurement, and environment. The last step is to brainstorm what specific causes that could emanate from the main-cause category. This will essentially be a sub-category.
At this point, you will need members of your team who have a grounded knowledge of the main cause categories you have identified as they relate to your food business operation. For them to investigate and brainstorm, adding sub-categories to the main category, another root cause analysis tool, the 5 Whys can be employed in this case.
When you have completed the steps above, you will have a fishbone diagram that gives you a pictorial view of all the possible causes and their sub-units. What you will have to do next is to analyze them individually and prioritize them based on their potential to contribute to the problem.
To gather evidence to analyze and prioritize the potential causes identified in the Fishbone Diagram, you can employ various methods and techniques:
- Data Analysis: Review relevant data related to the problem at hand. This could include customer complaints, product inspection records, temperature logs, equipment maintenance reports, and any other relevant documentation. Analyze this data to identify patterns or trends that may point to specific causes.
- Observation and Inspection: Conduct on-site observations and inspections to assess the current state of operations. Observe how staff members handle ingredients, monitor temperature control measures, inspect equipment for signs of malfunction or wear, and evaluate overall cleanliness and hygiene practices.
- Interviews and Surveys: Engage with staff members, suppliers, and customers through interviews or surveys to gather firsthand insights. Ask specific questions related to each potential cause category to gather qualitative data on their experiences, observations, and suggestions for improvement.
- Benchmarking and Best Practices: Compare your food business operations with industry benchmarks and best practices. Identify areas where your practices may fall short or where improvements can be made based on industry standards.
- Expert Consultation: Seek advice and insights from subject matter experts, such as food safety specialists, quality assurance professionals, or consultants with expertise in your industry. They can provide valuable perspectives and recommendations based on their knowledge and experience.
Do you need assistance with conducting a root cause analysis for food safety and food quality issues in your food business? We are experts in conducting a root cause analysis and we are ready to partner with you to assist your business with resolving food quality and food safety issues so that you can focus on other key areas of running your food business.
Please be in touch with us at Fresh Group to book your consultation!
FSQ Writer: Oluwatobi Eniyandunmo
Reviewed by: Raphael Samson
Kindly reach out to Fresh Group Food Safety And Quality Consulting for any food quality and safety inquiries.


